

Search engine optimization can feel like a moving target: algorithms change, competitors adapt, and user behavior keeps evolving. That is why an SEO infographic is such a useful way to communicate the essentials. By turning complex ranking factors into a clear visual structure, an infographic helps marketers, business owners, writers, and designers quickly understand what matters most for visibility in search.
TLDR: A strong SEO infographic should highlight the core elements that help a website rank: keyword research, quality content, technical optimization, user experience, backlinks, and performance tracking. The best infographics make complicated concepts easy to scan, remember, and apply. Think of it as a visual checklist for building search-friendly pages that serve both users and search engines.
Contents
- 1 Why SEO Infographics Work
- 2 1. Keyword Research: The Foundation of SEO
- 3 2. High-Quality Content: The Core Ranking Asset
- 4 3. On-Page SEO: Helping Search Engines Understand the Page
- 5 4. Technical SEO: Making the Site Search-Friendly
- 6 5. User Experience: Keeping Visitors Engaged
- 7 6. Backlinks and Authority: Building Trust Online
- 8 7. Measurement: Tracking What Works
- 9 What Makes an SEO Infographic Effective?
- 10 Final Thoughts
Why SEO Infographics Work
SEO involves many layers, from on-page details like title tags to broader strategies such as authority building. When presented as a long report, these details can overwhelm readers. An infographic, however, organizes information into sections, icons, charts, and concise explanations. This makes it easier to understand how each SEO element connects to the next.
A good infographic is not just decorative. It is educational. It can explain what to optimize, why it matters, and how each action supports search performance. For teams, it can also become a shared reference point, helping content creators, developers, and marketers stay aligned.

1. Keyword Research: The Foundation of SEO
Every effective SEO strategy begins with understanding what people are searching for. Keyword research reveals the words and phrases your audience uses when looking for information, products, or services. These keywords guide your content topics, page structure, headings, and metadata.
An infographic should show keyword research as the starting point because it influences nearly everything else. Important keyword elements include:
- Search intent: Does the user want information, a product, a comparison, or a local service?
- Search volume: How often is the keyword searched?
- Competition: How difficult is it to rank for the term?
- Long-tail keywords: More specific phrases that often attract highly motivated visitors.
For example, “SEO” is broad and competitive, while “SEO checklist for small business websites” is more specific and easier to match with useful content. A strong SEO infographic can use a funnel or branching diagram to show how broad topics become targeted keyword opportunities.
2. High-Quality Content: The Core Ranking Asset
Search engines are designed to satisfy users. That means content quality is central to SEO. Pages should answer questions clearly, provide depth, and offer something better than what users can already find elsewhere. Content that is thin, outdated, duplicated, or stuffed with keywords is unlikely to perform well over time.
An infographic about essential SEO elements should emphasize these content principles:
- Relevance: Content should match the user’s search intent.
- Originality: Add unique insights, examples, data, or explanations.
- Structure: Use headings, short paragraphs, and logical sections.
- Readability: Write in a clear, helpful, human tone.
- Freshness: Update content when facts, trends, or best practices change.
Content is also where SEO and branding meet. A useful page can build trust, demonstrate expertise, and encourage visitors to explore more of your site. In an infographic, this section can be represented as the “engine” of SEO because it powers organic visibility.
3. On-Page SEO: Helping Search Engines Understand the Page
On-page SEO refers to the elements you can optimize directly on a webpage. These signals help search engines understand the topic, context, and value of your content. They also help users decide whether your page is worth clicking and reading.
Key on-page elements include:
- Title tags: The clickable headline that appears in search results.
- Meta descriptions: Short summaries that can improve click-through rates.
- Headings: H1, H2, and H3 tags that organize content.
- Internal links: Links to related pages on your own website.
- Image alt text: Descriptions that help accessibility and image search.
- Clean URLs: Simple, readable web addresses that describe the page.
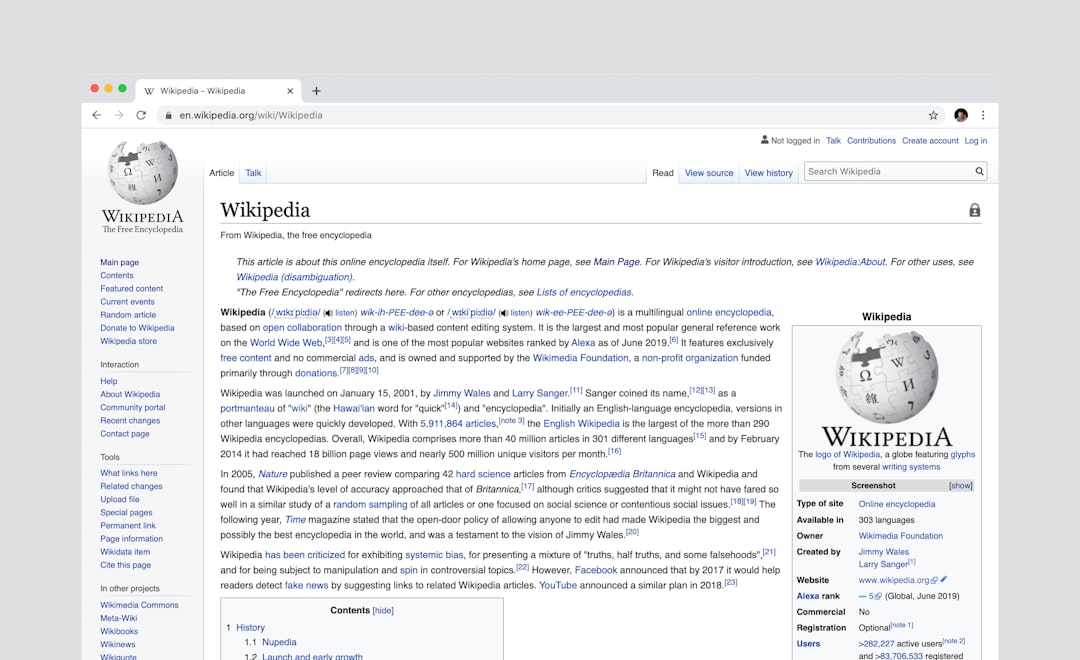
An infographic can present these as labels on a sample webpage, making it easy for readers to see exactly where each SEO element appears. This is especially useful for beginners who know the terms but may not understand their placement.
4. Technical SEO: Making the Site Search-Friendly
Even excellent content can struggle if a website has technical problems. Technical SEO ensures that search engines can crawl, index, and understand your site efficiently. It also supports a smoother user experience.
Important technical SEO elements include:
- Mobile friendliness: Pages must work well on smartphones and tablets.
- Site speed: Faster loading improves usability and can support rankings.
- Secure browsing: HTTPS helps protect users and build trust.
- XML sitemaps: These help search engines discover important pages.
- Robots directives: These guide search engines on what to crawl or avoid.
- Structured data: Schema markup can help search engines interpret content and display rich results.
In infographic form, technical SEO often works well as a checklist or dashboard. Green check marks, warning icons, and speed indicators can quickly show which areas are healthy and which need attention.
5. User Experience: Keeping Visitors Engaged
SEO is not only about getting people to a page; it is also about what happens after they arrive. If visitors immediately leave because the site is confusing, slow, or difficult to navigate, performance may suffer. Search engines increasingly reward pages that provide a satisfying experience.
Good user experience includes clear navigation, fast loading, readable typography, accessible design, and content that is easy to scan. Calls to action should be visible but not disruptive. Pop-ups, cluttered layouts, and intrusive ads can reduce trust and engagement.
An infographic can show user experience as a bridge between SEO and conversion. Ranking brings traffic, but usability turns traffic into subscribers, leads, customers, or loyal readers.
6. Backlinks and Authority: Building Trust Online
Backlinks are links from other websites to yours. Search engines often treat quality backlinks as signals of credibility. If reputable sites link to your content, it suggests that your page offers value. However, not all links are equal. A link from a trusted industry publication is typically more valuable than dozens of links from low-quality directories.
Effective link building is usually based on earning attention through valuable assets, such as:
- Original research or statistics
- Helpful guides and tutorials
- Infographics that others want to reference
- Expert commentary or interviews
- Useful tools, templates, or resources
This is where an SEO infographic can become part of the strategy itself. If it is visually appealing and genuinely helpful, other websites may share or cite it, creating natural opportunities for backlinks.

7. Measurement: Tracking What Works
SEO is not a one-time task. It requires monitoring, testing, and improvement. Analytics show which pages attract traffic, which keywords bring visitors, and where users drop off. Without measurement, it is difficult to know whether your efforts are producing results.
Common SEO metrics include:
- Organic traffic: Visitors arriving from unpaid search results.
- Keyword rankings: Positions for target search terms.
- Click-through rate: The percentage of searchers who click your result.
- Bounce rate and engagement: Signals of how users interact with content.
- Conversions: Actions such as purchases, sign-ups, downloads, or inquiries.
In an infographic, this section can be shown as a feedback loop: research, optimize, publish, measure, improve. This reminds readers that SEO is continuous rather than static.
What Makes an SEO Infographic Effective?
The best SEO infographics are simple enough to scan but detailed enough to be useful. They use hierarchy, color, spacing, and icons to guide the eye. Each section should answer a practical question, such as “What should I optimize?” or “Why does this matter?”
To make an infographic more effective, keep these design and content tips in mind:
- Use clear section labels so readers can follow the SEO workflow.
- Keep text concise and avoid turning the design into a full article.
- Prioritize accuracy over trendy claims or oversimplified promises.
- Include visual relationships, such as funnels, cycles, or checklists.
- Make it shareable by focusing on practical value and clean presentation.
Final Thoughts
An SEO infographic is more than a visual summary; it is a strategic map. By presenting keyword research, content quality, on-page optimization, technical health, user experience, backlinks, and measurement in one clear format, it helps people see the bigger picture. Whether used for training, planning, or content marketing, a well-made infographic can turn SEO from a confusing list of tasks into an organized and actionable process.

