

When a process fails, a server goes down, a customer complains, or a production line stops, the first explanation is often only the most visible symptom. Root Cause Analysis, or RCA, helps teams look beneath the obvious problem and identify what truly caused it. A good RCA template turns scattered observations into a structured investigation, making it easier to prevent the same issue from happening again.
TLDR: A root cause analysis template helps teams document what happened, why it happened, and what corrective actions will prevent recurrence. For example, if a warehouse ships 12% of orders late in one week, RCA may reveal the real cause is not “slow staff,” but a barcode scanner outage that delayed picking. Methods like the 5 Whys, Fishbone Diagram, and RCA tools help teams move from blame to practical solutions. The best templates are simple, evidence based, and tied to measurable action items.
Contents
What Is a Root Cause Analysis Template?
A root cause analysis template is a repeatable document or framework used to investigate incidents, defects, failures, delays, safety issues, or performance gaps. Instead of asking only what went wrong, it asks why it happened and what conditions allowed it to happen.
Most RCA templates include sections for:
- Problem statement: A clear description of the issue.
- Impact: Business, financial, operational, safety, or customer consequences.
- Timeline: Key events before, during, and after the incident.
- Evidence: Logs, screenshots, interviews, metrics, photos, or reports.
- Root cause: The underlying reason the issue occurred.
- Corrective actions: Steps to fix the current issue.
- Preventive actions: Steps to stop recurrence.
- Owner and deadline: Accountability for each action.
The value of a template is consistency. When every incident is analyzed in the same format, trends become easier to identify. Over time, organizations can see whether most failures come from training gaps, outdated systems, unclear handoffs, weak quality checks, or supplier inconsistencies.

Example Root Cause Analysis Template
Here is a practical RCA template that can be used for IT, operations, manufacturing, healthcare, customer service, logistics, and other business functions:
- Incident title: Short name for the problem.
- Date and time reported: When the issue was first discovered.
- Reported by: Person or team that identified the problem.
- Problem description: What happened, where it happened, and who was affected.
- Immediate containment: What was done to reduce damage or restore service.
- Data collected: Metrics, system logs, inspection reports, customer feedback, or audit findings.
- RCA method used: 5 Whys, Fishbone, Pareto analysis, fault tree, or another method.
- Root cause identified: The deepest verified cause, not just a symptom.
- Corrective action plan: Specific actions, owners, timelines, and success measures.
- Verification: How the team will confirm the fix worked.
- Lessons learned: What should change in training, systems, policies, or monitoring.
For instance, a software company might record: “Customers could not log in for 47 minutes due to an expired authentication certificate.” The immediate fix is renewing the certificate. The root cause, however, might be “certificate expiration was not monitored and no owner was assigned.” The preventive action would be to add automated alerts 30 days before expiration and assign ownership to the infrastructure team.
The 5 Whys Method
The 5 Whys method is one of the simplest and most popular RCA techniques. It involves asking “Why?” repeatedly until the team reaches a cause that can be addressed. It does not always require exactly five questions; sometimes three are enough, and sometimes seven are needed.
Example: A customer order was delivered late.
- Why was the order late? Because it was packed two days after the promised date.
- Why was it packed late? Because the item was not available in the picking area.
- Why was it not available? Because replenishment from bulk storage did not happen.
- Why did replenishment not happen? Because the inventory alert was not triggered.
- Why was the alert not triggered? Because the reorder threshold was set incorrectly after a seasonal demand change.
In this example, the root cause is not “warehouse delay.” It is an incorrect inventory threshold. A useful corrective action would be to review reorder points weekly for high-demand items and automate alerts when demand changes by more than 15%.
The strength of the 5 Whys is speed. The weakness is that it can oversimplify complex problems if the team relies on assumptions instead of evidence. For best results, each answer should be supported by data, observation, or expert input.
Fishbone Diagram, Also Called Ishikawa Diagram
A Fishbone Diagram is a visual tool that organizes potential causes into categories. It is especially useful when a problem may have multiple contributing factors. The diagram looks like a fish skeleton: the problem is placed at the head, and cause categories form the bones.
Common Fishbone categories include:
- People: Skills, staffing, communication, fatigue, training.
- Process: Procedures, handoffs, approvals, quality checks.
- Technology: Software, machines, hardware, integrations, automation.
- Materials: Supplies, components, data inputs, packaging.
- Environment: Workspace, temperature, noise, layout, external conditions.
- Management: Policies, priorities, supervision, resource allocation.

Imagine a call center where customer satisfaction drops from 91% to 78% in one month. A Fishbone Diagram may reveal several possible causes: new agents with limited training, a slower CRM system, unclear refund policies, higher call volume, and increased hold times. The final RCA might show that the main driver was a software update that added 40 seconds to average account lookup time, causing longer calls and customer frustration.
Other Root Cause Analysis Methods
While the 5 Whys and Fishbone Diagram are widely used, other RCA methods can provide deeper insight depending on the situation.
- Pareto Analysis: Based on the 80/20 principle, this method identifies the few causes responsible for most problems. For example, 20% of defect types may account for 80% of product returns.
- Fault Tree Analysis: A top-down method often used in engineering, safety, and risk management. It maps how combinations of failures can lead to a major event.
- Failure Mode and Effects Analysis: Also known as FMEA, this method predicts possible failures before they occur and ranks them by severity, likelihood, and detectability.
- Change Analysis: This compares what changed before the incident against normal conditions. It is useful for IT outages, process failures, and sudden quality issues.
- Scatter Plot Analysis: This checks whether two variables may be related, such as machine temperature and defect rate.
RCA Tools That Make the Process Easier
Modern RCA tools range from simple spreadsheets to advanced workflow platforms. The best tool depends on the complexity of your process and the volume of incidents you handle.
Common RCA tools include:
- Spreadsheets: Useful for small teams that need a simple log of causes, actions, and deadlines.
- Project management software: Helps assign corrective actions, track owners, and monitor completion dates.
- Diagramming tools: Ideal for Fishbone Diagrams, process maps, and fault trees.
- Incident management platforms: Common in IT, security, healthcare, and operations where audit trails matter.
- Business intelligence dashboards: Useful for spotting recurring patterns across multiple RCA reports.
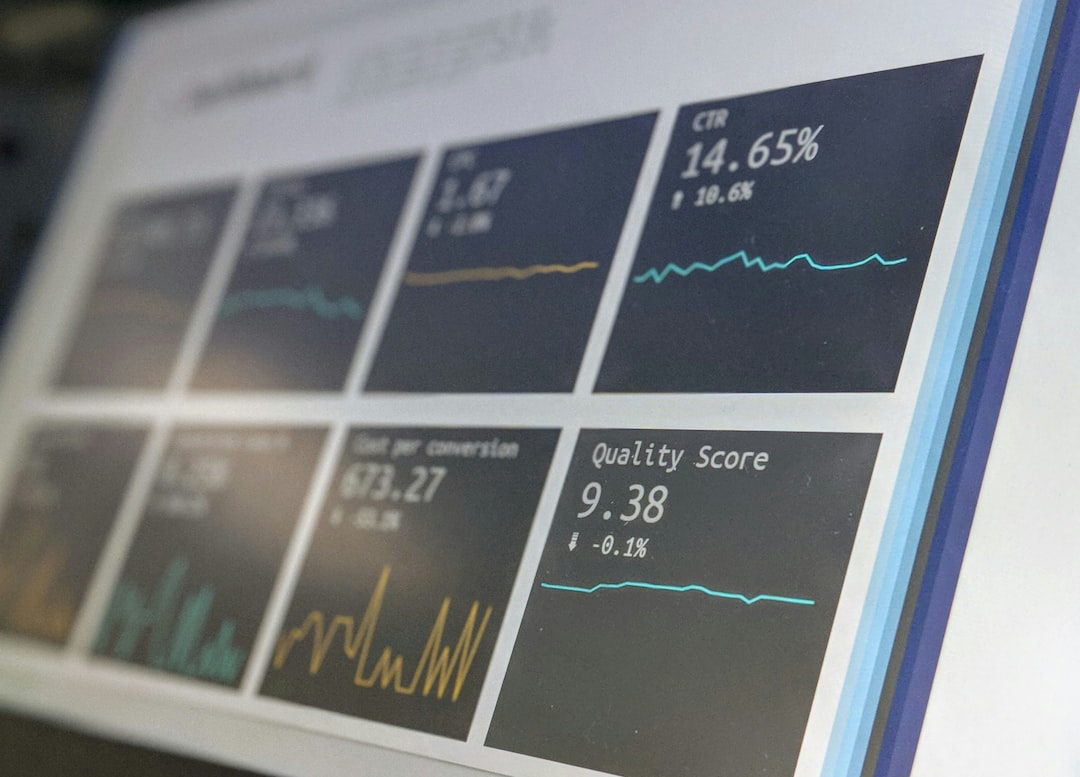
A strong RCA tool should support collaboration, version history, evidence storage, action tracking, and reporting. If an organization completes dozens of analyses each quarter, dashboards can show whether corrective actions are reducing repeat incidents. For example, a logistics firm might track damaged shipments and discover that after changing packaging standards, damage claims fell from 6.5% to 2.1% within three months.
Tips for Running an Effective RCA
Successful RCA depends as much on mindset as methodology. The goal is not to blame individuals, but to improve systems. If employees fear punishment, they may hide details or provide incomplete information.
- Define the problem precisely: “Machine B stopped for 34 minutes” is better than “production failed.”
- Use evidence: Avoid guessing. Review logs, records, photos, timestamps, and interviews.
- Separate symptoms from causes: A missed deadline may be a symptom of unclear priorities or resource shortages.
- Look for process weaknesses: Human error often points to poor training, confusing interfaces, or missing safeguards.
- Assign owners: Every action should have a responsible person and due date.
- Verify results: Confirm that the fix actually reduced or eliminated the problem.
Conclusion
A root cause analysis template is more than a form; it is a practical decision-making tool. It helps teams slow down, examine facts, and identify solutions that last. Whether you use the 5 Whys for a quick investigation, a Fishbone Diagram for complex brainstorming, or advanced RCA tools for enterprise reporting, the principle is the same: fix the cause, not just the symptom. When RCA becomes a habit, organizations reduce repeat failures, improve reliability, and build a culture of continuous learning.

